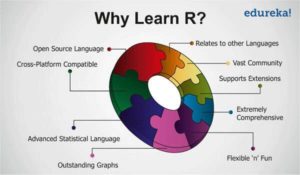
R is a free software environment for statistical computing and graphics. It is primarily used by economists to present and display data. It is a robust tool used to present and support different hypotheses, run regression, test for irregularities in data and to create graphs.
Please bring your own laptop to the workshop.
Agenda
Downloading the software
Users must download and install the software in this order:
Uses of R
How to use R as a calculator
How to create graphs and visual representation using R
How to import data into R
How to run a regression
How to export regression tables
Commands for common tests & transformations
For additional resources:
Visit the R Project for Statistical Computing website.
