Loyola University Chicago hosted the DHCS 2018 Conference on November 9th – 11th showcasing graduate and professional scholars in many unique projects in the Digital Humanities. Below are a few projects that allowed me to bring back new ideas to Wooster.
The Muddle Project
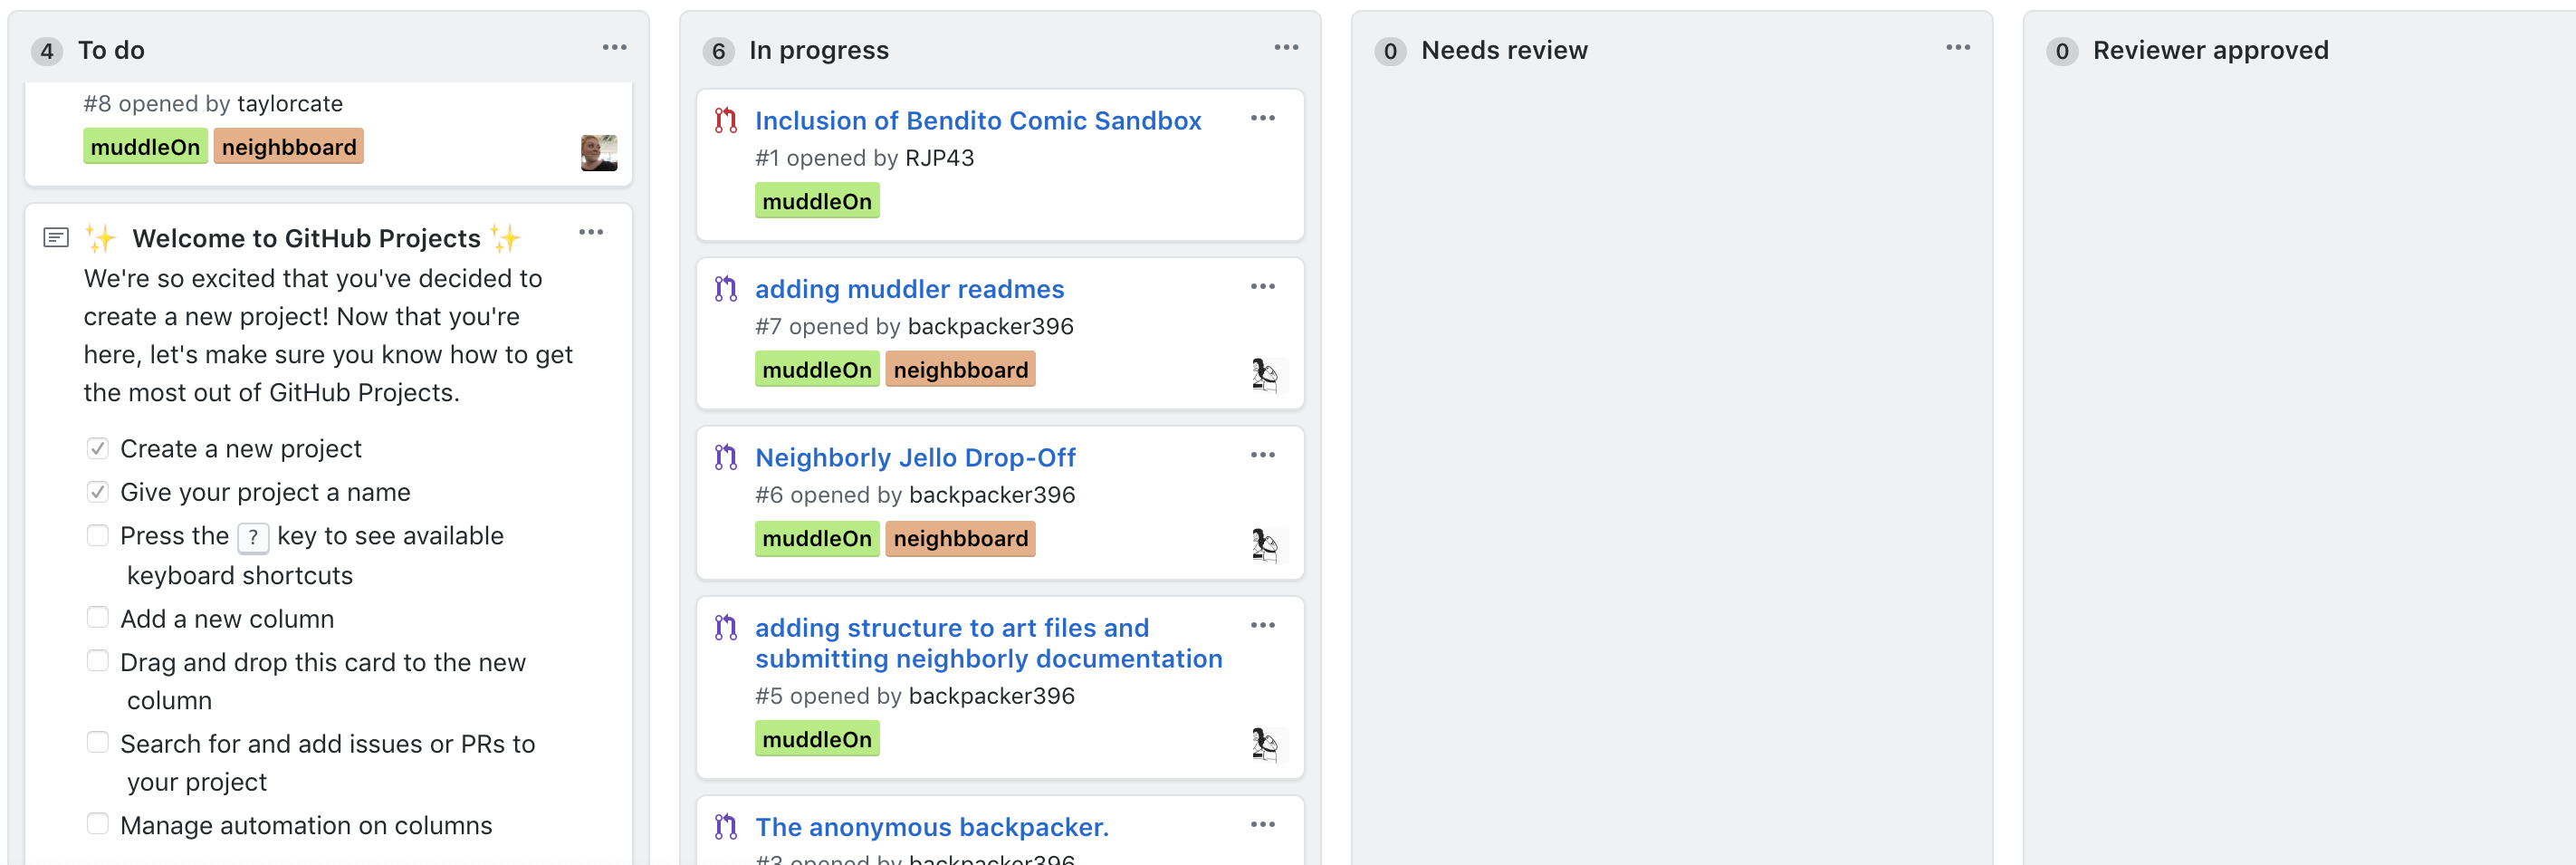
Loyola graduate students Taylor Brown and Rebecca Parker introduced and workshoped their git-hub oriented project in order to encourage the humanities to save their work in a workflow that allows for users to view the progression of the author’s work instead of just the final product. Their final goal is to take the content from git-hub into a literary magazine in May 2019. Brown and Parker uses git-hub as Muddle’s “backyard” for content creators to share updates and progress on works that allows others from the “neighborhood” to leave feedback.
Muddle introduces git-hub in a friendly way for creatives by having a Muddle Workflow found on their wiki. Along with this technical support, there are “NeighBBoards” acting as a discussion forum and pinned messages creators can leave on individual works for feedback.
The other unique component to Muddle’s git-hub interface is the progress bar and post-it note like check lists it generates. Creators can visualize their how far they are in their project and tasks that need to be done in order to complete it for upcoming editions.

While in the early stages of the project, Brown and Parker are clearly creating a social media-like feel for creators to foster the creative process as a community and help digitize and visualize a project’s progression to completion leading to a digital literary magazine.
The Charles Harpur Critical Archive
The Charles Harpur digital archive holds the Wales poet’s works and letters. This website not only acts as an archive of Harpur’s works, but also acts as an online textual analysis tool.
Separated by poems and letters, visitors of the site can see a specific work from the archive and its multiple iterations. Harpur’s poems can be viewed individually, side-by-side, or in a layered perspective.
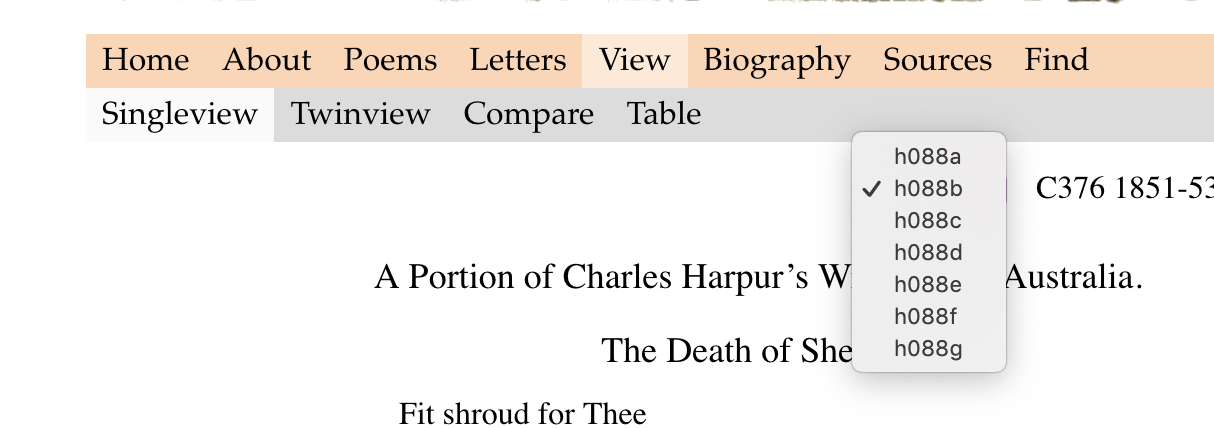
The “Twinview” is the most interesting perspective for scholars to analyze the text and manuscript simultaneously. Users can see the original document and the text side-by-side along with changes in work over the years.
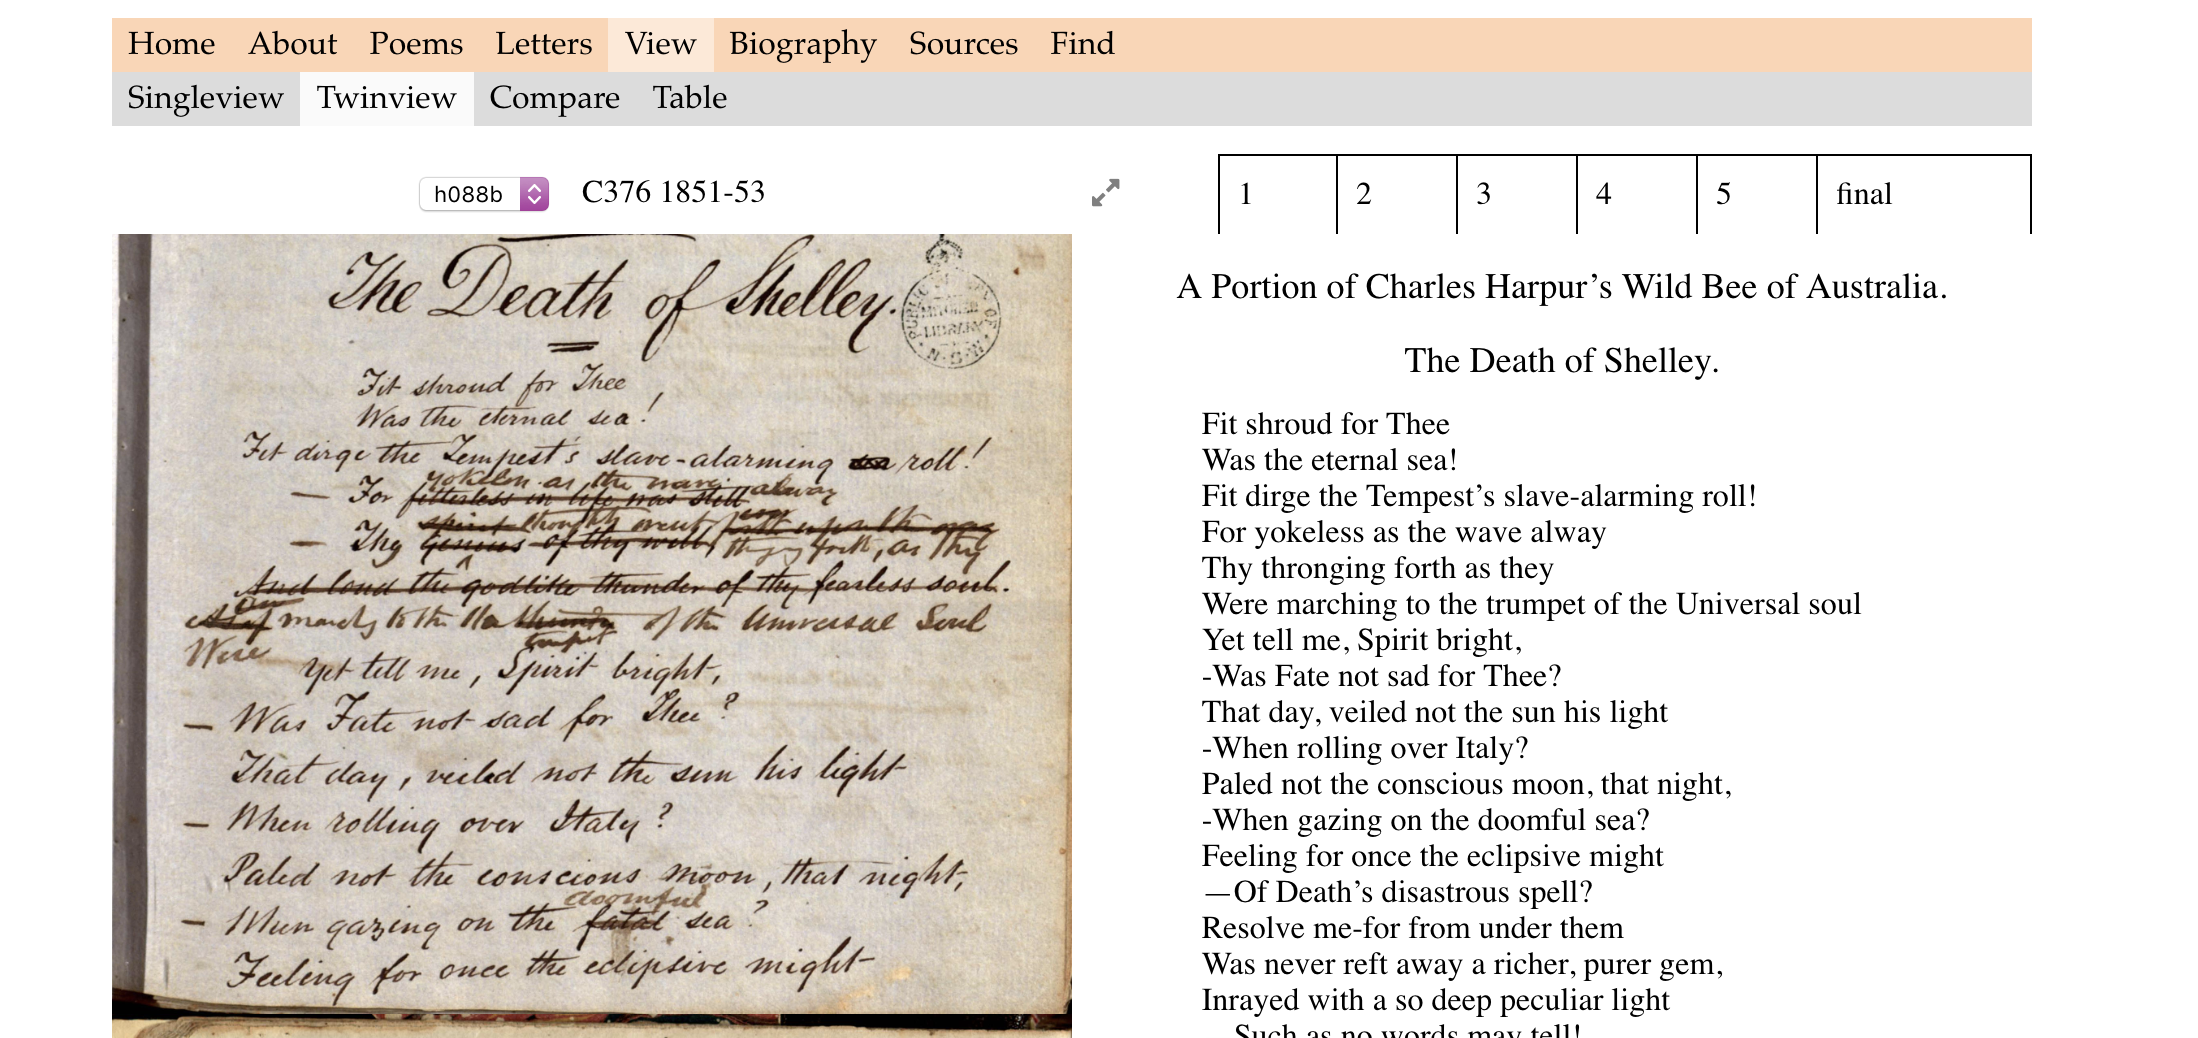
This digital archive advances the ways scholars can see multiple works and changes in the same pieces. With advantages of seeing the original document and text in tandem, it allows for easier understanding of older manuscripts and follow the changes writers have done to it.
The CEDAR Project
Using University of Chicago’s OCHRE database service, the CEDAR (Critical Editions for Digital Analysis and Research) Project uses its services to further study ancient texts (the Gilgamesh Epic, the Bible, and Shakespeare’s plays).
At DHCS, Sarah Yardney a PhD candidate at University of Chicago’s Divinity School, presented CEDAR in context of analyzing the Genesis text from the Bible. Taking advantage of XML files the OCHRE data base uses, the biblical texts are not only broken down by character but by parts of that character.
For example, the Hebrew letter kaf is broken into two files. The first file would have the “box” and the second file would act as the child of the first file which contains the “dot” in the middle of the “box”. This is a very loose description with my lack knowledge Hebrew.

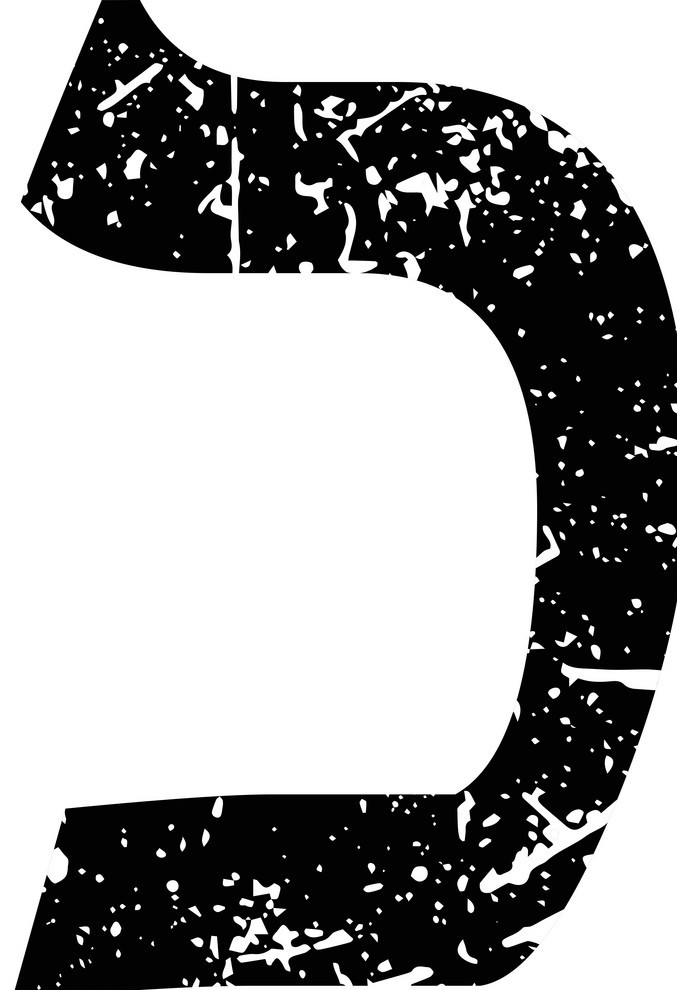
By breaking down the letters into separate parent-child files, the database can catch characters that are similar in ancient Greek documents. Catching similarities aides in the tracking of the changes or transformation of the letters throughout long periods of time. CEDAR also includes the ability to view the original document and highlight the difference in various manuscripts for users to easily view.
Changing Lanes: A Reanimation of Shell Oil’s Carol Lane
Melissa Dollman’s PhD dissertation is facilitating website development to follow the multiple women acting as public figures for Shell Oil Company known as Carol Lane. Carol Lane was a spokeswoman for Shell to represent the female driving demographic. Dollman found it interesting that Shell decided to have multiple women act as Carol Lane instead of having one woman taking on the role.
Using ArcGIS, Dollman connects images, videos, and interviews she has conducted to a map of the US to track Carol Lane’s activities. The alternate option is to view the material in a timeline format too. Using Tableau and SocialExplorer, users have the ability to see statistics based on age, location, duration of work, etc in real time using the interface Dollman is developing. She intends to take the this public facing component of her thesis for analysis and writing once she nears the end of her PhD program as University of North Carolina Chapel Hill.
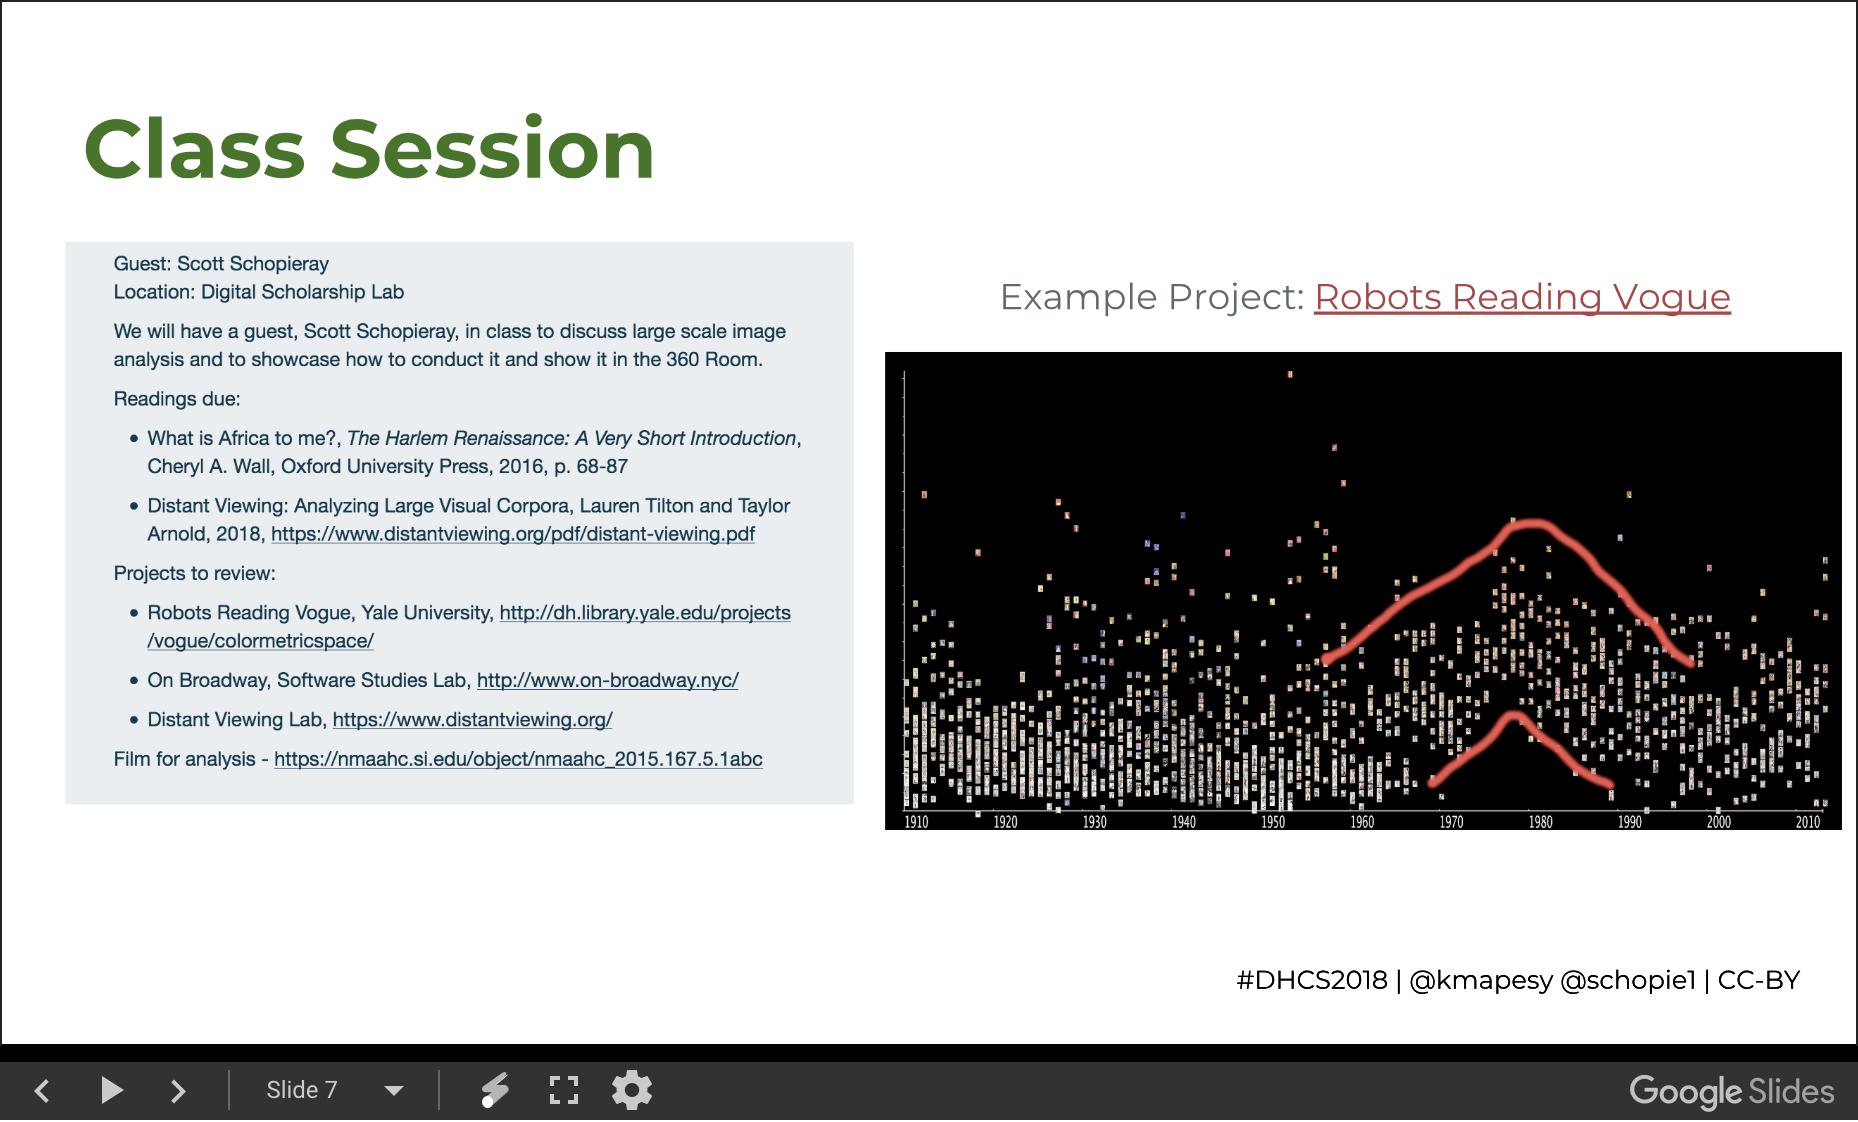
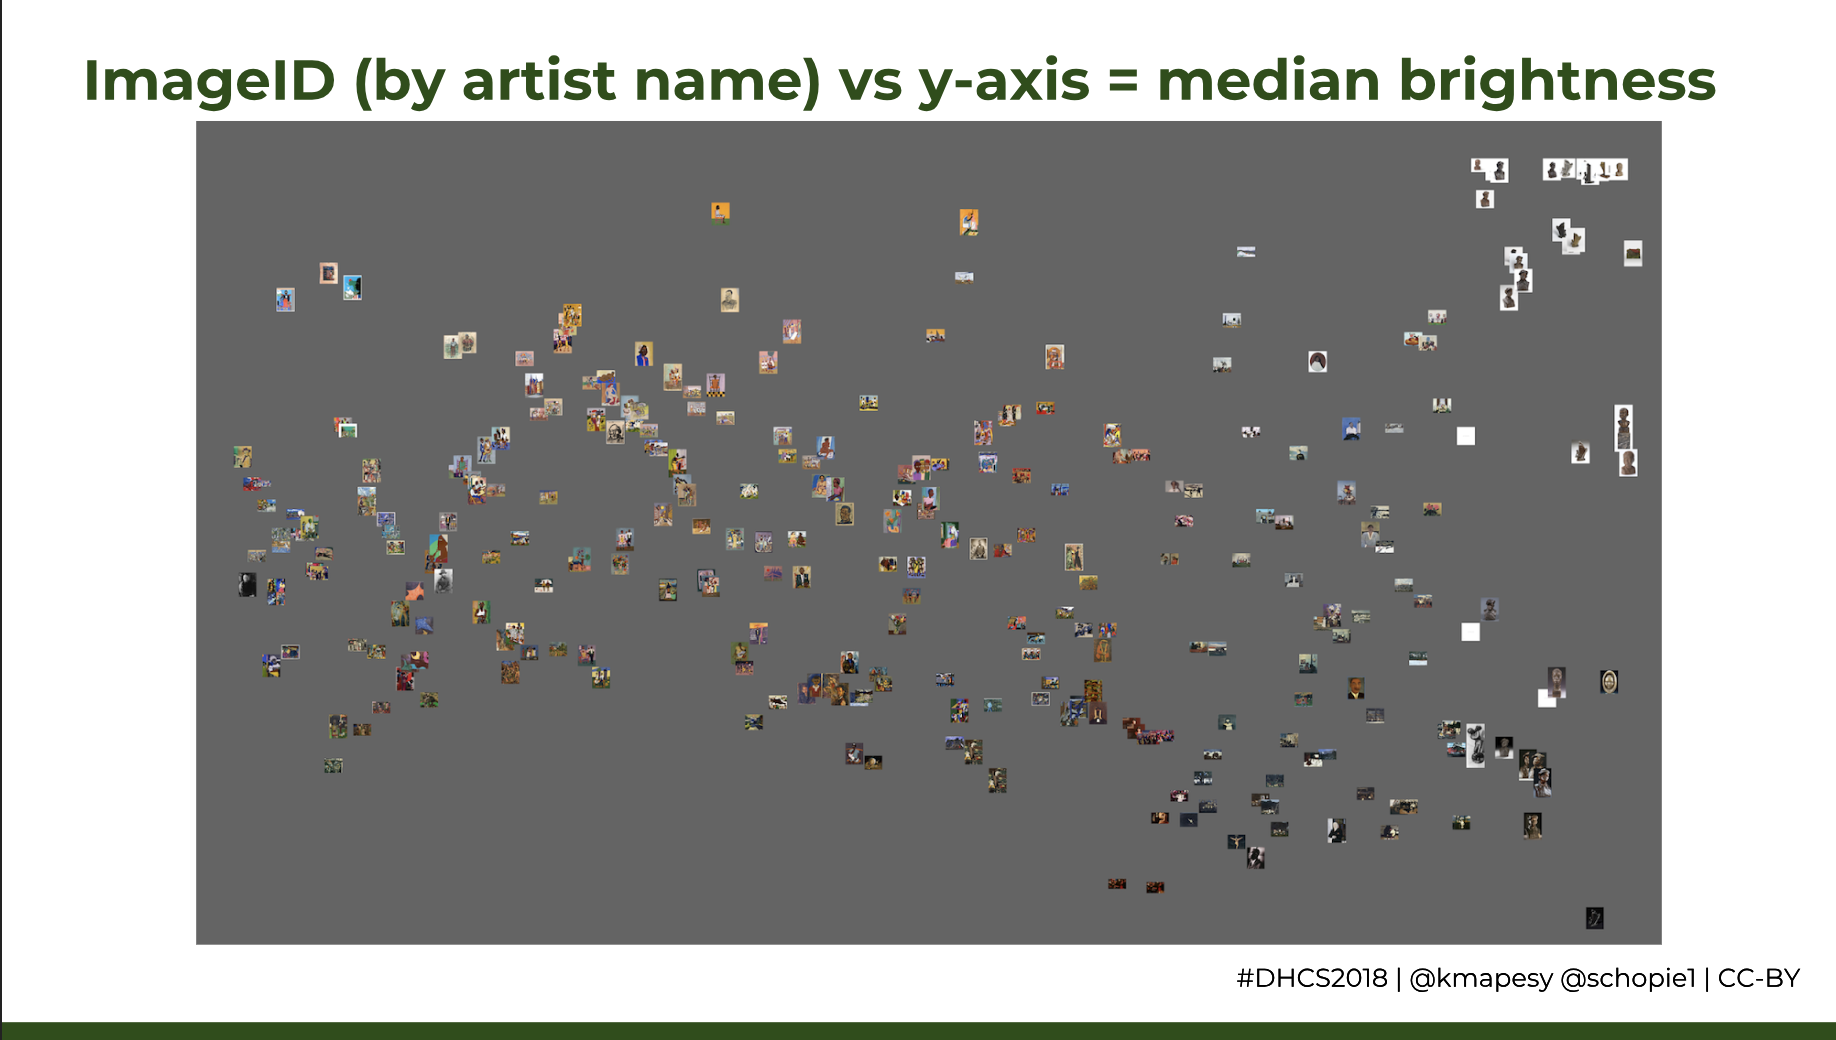
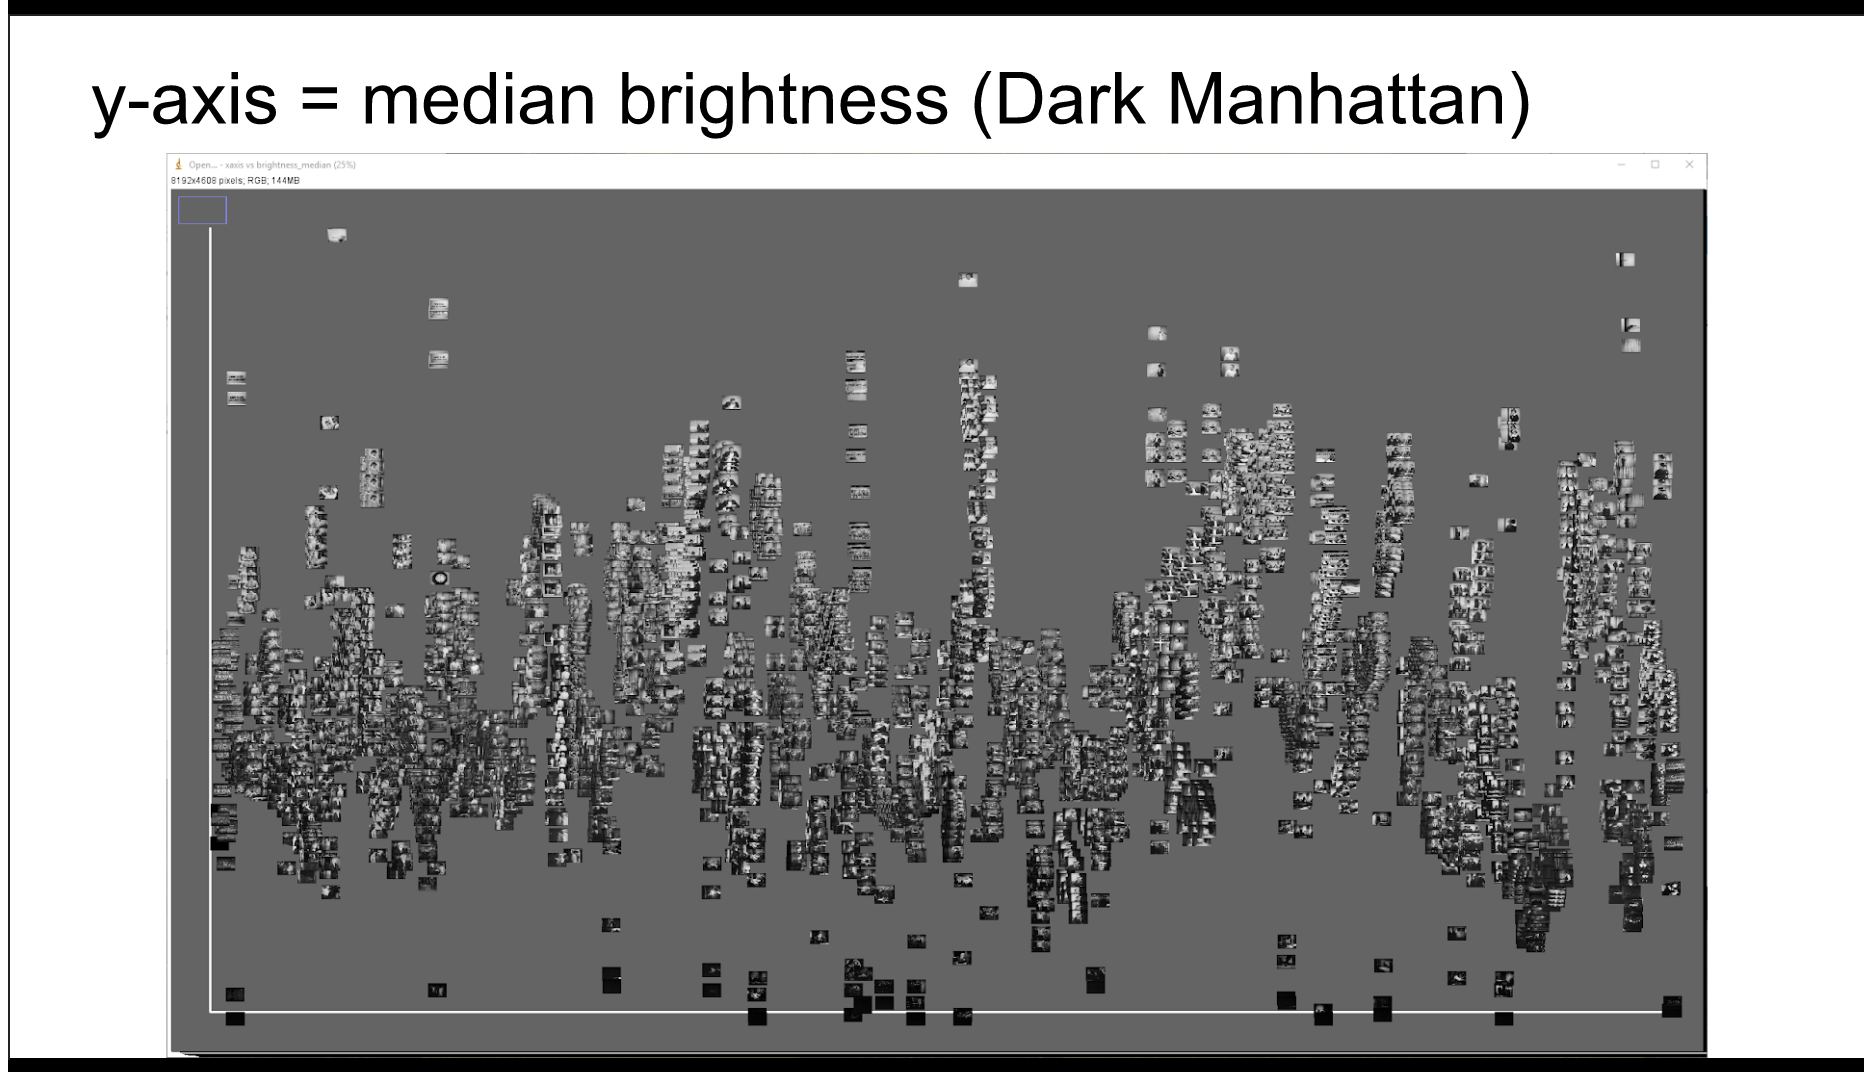
Image Plot
Image Plot is a visualization software that can organize video clips and collections of images into graphical data sets. The software can organize users data into several different sets such as dates, times, and visual characteristics found in the image. There is no limit on how many images or clips Image Plot can organize, making it ideal for larger projects.
Kristen Mapes at Michigan State University, used this in her Intro to Digital Humanities class to learn a new method in analyzing images and video. This was also an opportunity to teach her students how to analyze data if they don’t come from a scientific background.